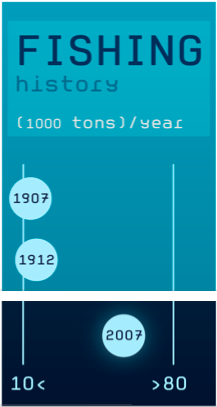
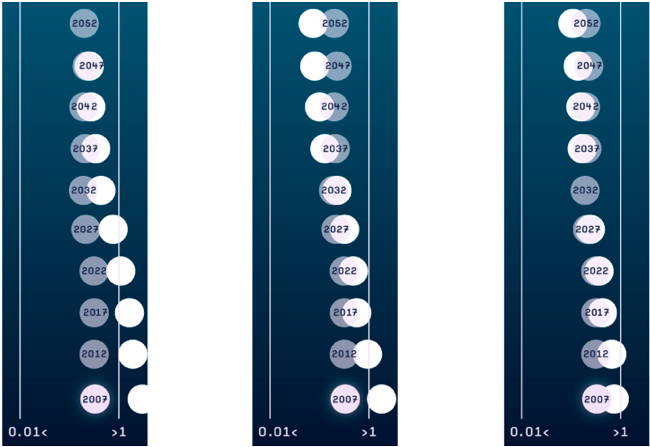
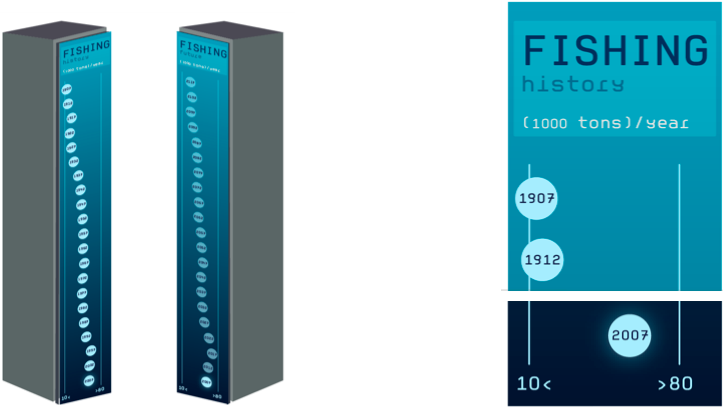
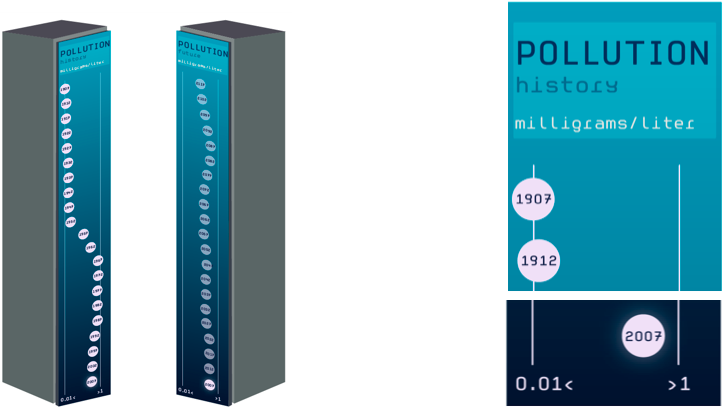
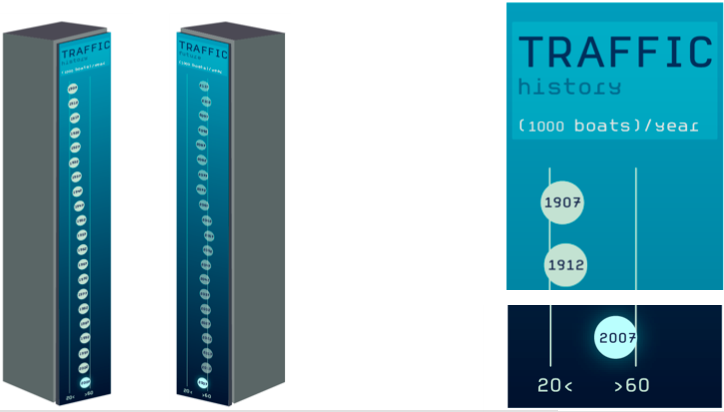
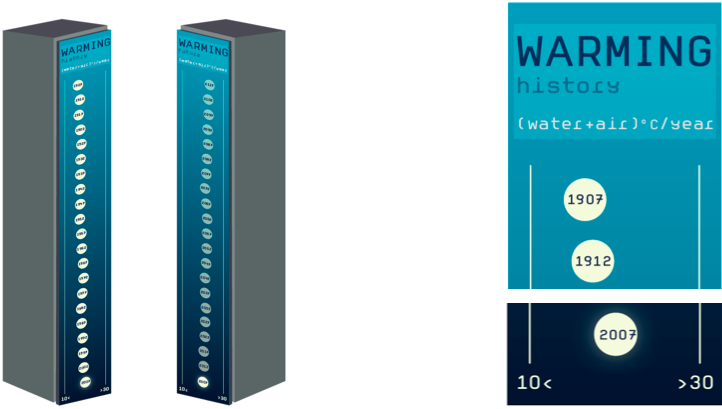
The columns’ headers contain the type of data displayed and the measure unit used. Both past and future prediction columns has two vertical lines showing the sustainable (on the left) and the critical (on the right) levels. The circles contain the year and their horizontal position describes the quantity.
In the future columns the fixed prediction lines generated by the computer are display with more transparent circles while the white circles represent the evolving prediction affected by the visitors’ behaviour.
FISHING
POLLUTION
TRAFFIC
WARMING
> Watch the video of the prototype.
> Next.